Hypothesis Testing, P-Value: Things We Learn From an Anime
They say it is only everybody that knows almost everything and I agree. I rarely claim to know about a concept. The only thing that I’m certain about, is that there is always something, somewhere about that concept that I don’t know. But this is good news, this means that there’s always room for learning more, and I can keep learning and understanding.
Hypothesis testing is one of the pillars of scientific discoveries. After observations, hypotheses are made, and surely, they need to be tested one way or another. Let’s try to understand what it takes to test a hypothesis.
The way I’m going to structure this post and demonstrate how the statistics behind scientific discoveries works, comes from an unlikely source. In its first episode, the 2020 anime Science Fell in Love, So I Tried to Prove It, demonstrates the essence of hypothesis testing in a way none of my professors could. What I do here is building upon that demonstration and adding a very small amount of R and mathematical mojo.
Suppose you’re a scientist living in a magical land and you want to prove that all the crows in this magical land are black, however your magical powers can only take a random sample of 100 crows and this can happen only once. You cast the spell, out of all the crows in the land, a random sample of 100 crows appear in front of you and you check them: they are all indeed black.
Does this mean you can victoriously claim that all crows are black? You know very well that any critic, even you yourself, can always say that you have reached this conclusion, only because of your limited powers of magic, because of the small sample size, and not because all the crows are black like you’re implying. How do you know that there wouldn’t have been a crow of a different color, had your magical powers enabled you to take a larger sample of the crows of the land? This is a question to be considered.
 1
1
Does your limited powers of observation mean that you can claim nothing unless you can do a full survey of all the crows in the world? Not really; even with limited powers of random sampling, you can still make very reliable claims using probabilities and contradiction.
To any critic, you can say, alright, probably you’re right, perhaps not all crows are black. What percentage of crows do you claim to be non-black? Let’s say they suggest that 50% of the crows are not black.
But if this is the case, given that your sample is truly randomly chosen, you can calculate the possibility of getting such a sample from a population of crows that one half of it is black, and the other half is not.
A crow can be either black or not. If we were dealing with just choosing one random crow from the population, we’d have a distribution called the Bernoulli distribution, since we have multiple crows drawn out from the population, we’re dealing with a Binomial distribution. In the formula below, p is the chance that a crow is black, k is the number of time’s we’ve seen a black crow in our sample and n is the total number of the times we’ve drawn out a crow from the population.
\[ P(X=k)=\binom{n}{k}(p)^k(1-p)^{n-k} \]Here’s the chance of getting 100 black crows given that half of the crows are black and the other half are not:
\[ P(X=100)=\binom{100}{100}(\frac{1}{2})^{100}(\frac{1}{2})^{0}\approx 7.888\times10^{-31} \]This small values doesn’t sound very probable, does it?
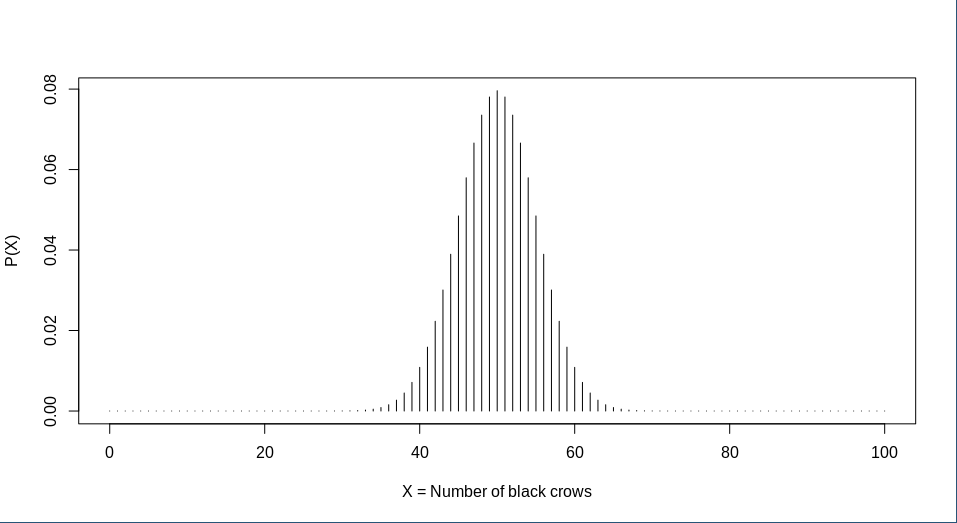
You can even see it on the graph, the likelihood of getting 65 crows that are all black in this scenario is very unlikely, let alone 100 crows that are all black.
We’d get the same improbable results unless the critic increases their evaluation of the portion of crows they think are black. Let’s say they argue that, yes, most crows are black but there’s a very small portion of crows that are non-black, and this rarity is why we have missed the non-black ones.
For example they might say that only 4% of the crows are non-black and that’s why our sample of 100 has missed them.
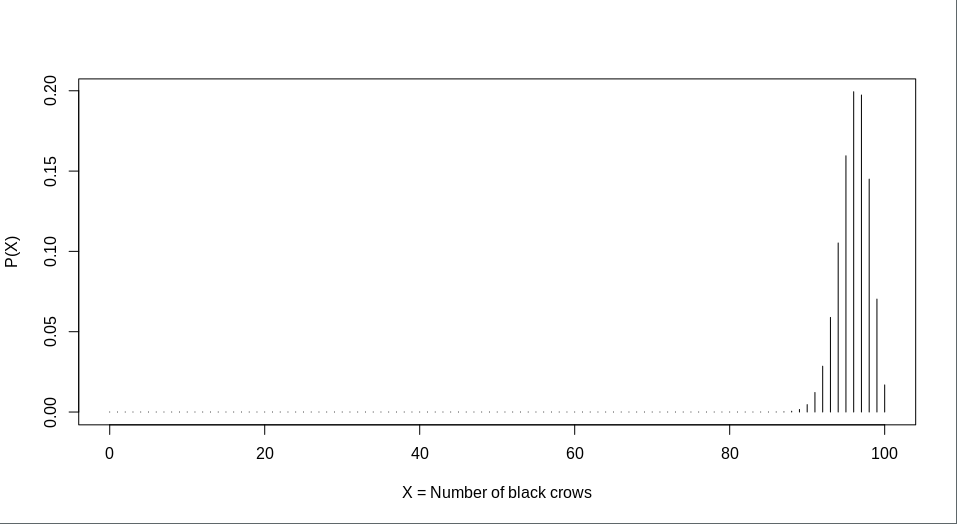
We can argue, once more, that even this time the chances that we have missed the non-black crows because of the sample size is really low, the probability that a random sample of 100 black crows happens merely by chance, given that 4% of the crows of the population are non-black_is less than 1.7%.
\[ P(X=100)=\binom{100}{100}(0.96)^{100}(0.4)^{0}\approx 0.01687 \]If they’re smart enough, they can suggest a portion that actually undermines our findings, here’s how:
\[ P(X=100)=\binom{100}{100}(p)^{100}(1-p)^{0} = 0.05 \] \[ p^{100} = 5 \times 10^{-2} \Rightarrow p=5^{\frac{1}{100}} \times 10^{\frac{-2}{100}} \approx 0.9705 \]A binomial distribution with n=100 and p=0.9705 looks like this:
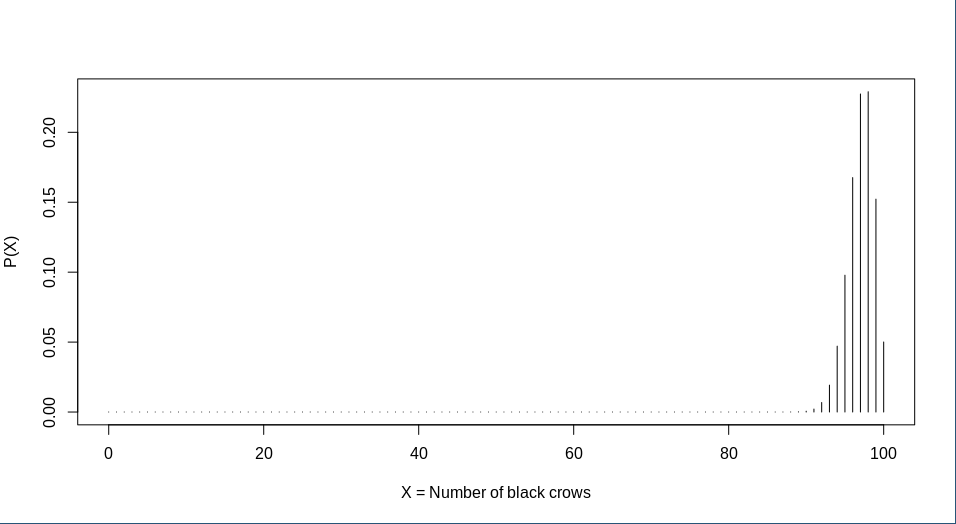
If they claim that 97.05% crows are black, now our sample size begins to make problems, the probability that a random sample of 100 black crows happens, given that 97.05% of the crows of the population are black is around 5%.
The sentences above in italic tell us what p-value means for our question. But we can state it in a more general form: it’s the probability that our sample (or what’s even more extreme than our sample) happens, given that the hypothesis we tried to contradict is true.
\[ p-value=P(\mbox{occurrence of our sample or more extreme case}|H_0) \]The use of contradiction happens right here: If this probability is very low, then maybe what we’re assuming is wrong? In different branches of science, 5% is what we call really low probability. If for our null hypothesis, our p-value drops to anything less than 5%, we say:
We reject the null hypothesis, in favor of the alternative hypothesis at the significance level of 5%
There are two important points to be made here. First: failing to reject the null hypothesis doesn’t mean it’s true, because you’re already assuming the null hypothesis in the calculations. It doesn’t make a whole lot of sense to accept the null hypothesis when you’re already assuming it. Null hypothesis can never be accepted, we can only reject it at a certain significance level or fail to reject it and that’s it.
The other point is that here we worked with the most extreme case, had we chosen another statement as our hypothesis, we would have to consider both our own case and the extremer ones to calculate the p-value.
At last, I encourage you to read about p-hacking and what it means for science in general. From what I’ve come to understand p-value is a great tool, but it can also be misused and misunderstood.
And oh… One more thing! Search for “p-value memes” or “null hypothesis memes” in your favorite web search engine, and have fun :)
-
Image © Acabashi CC-BY-SA 4.0 ↩︎